


by Greg Livingstone, Sanya Mathura
The mention of lubricant varnish in an industrial setting frequently evokes concerns regarding unscheduled equipment shutdowns, reliability challenges, and consequent extended downtime. However, a facet that often remains overlooked is the concept of ‘solubility.’
This underpins an understanding of how degradation products interact with lubricating oils. The idea of solubility, although seemingly esoteric, is central to devising robust strategies for lubricant degradation monitoring and management, thereby preemptively addressing varnish-related challenges and promoting operational excellence.
Understanding Solubility
Solubility is a fundamental chemical property referring to the ability of a substance (solute) to dissolve in a solvent to form a homogeneous solution at a particular temperature and pressure. Various factors, including the nature of the solute and solvent, temperature, pressure, and the presence of other substances, govern the extent of solubility.
Understanding solubility is crucial in industrial lubrication, especially regarding the behavior of oil degradation products within lubricating oils. As oils age, they undergo oxidative degradation and thermal breakdown, generating various degradation products like acids, aldehydes, ketones, and varnishes. The solubility of these degradation products in the lubricating oil will impact the fluid’s performance. Therefore, a thorough understanding of solubility principles and their application can significantly contribute to effective lubricant degradation monitoring and management in industrial settings.
Is It Soluble or Insoluble?
Oil degradation products are often considered soluble or insoluble. However, solubility can only be defined when associated with a certain temperature. Labeling degradation products as either soluble or insoluble can be an oversimplification, creating confusion. To clear up some of the misnomers about solubility, here are a few things to keep in mind:
- Varnish is insoluble while a machine is operational. If it were soluble, it would go back into solution. This doesn’t mean that varnish can never be dissolved. For example, if you increase the in-service oil’s temperature or its solubility using a solubility enhancer, varnish may become soluble and be dissolved into the oil.
- Oil degradation products are soluble when you obtain an oil sample. Oil degradation products can come out of solution once the sample is stored at room temperature. The exception is colloidal suspensions of degradation products, such as the carbonaceous soot particles produced in a diesel engine or a microdieseling process. Colloidal suspension refers to the dispersion of fine particles within the lubricant, where the particles are dispersed evenly but not dissolved. In this state, the particles remain suspended throughout the lubricant due to their small size (typically between 1 and 1000 nanometers) and interaction with the surrounding fluid.
- The MPC test (ASTM D 7843) measures soluble degradation products. That is, the degradation products are soluble while in the operating fluid. During the MPC test, the sample is heated to 65 °C for 24 hours to “reset” the sample. This dissolves any degradation products that may have settled out during shipping and handling. Then, the sample is stored at room temperature for 72 hours to provide a standardized time for the soluble degradation products to come out of solution. The exception is when colloidal suspensions are present from microdieseling events, which can be isolated with the 0.45mm membrane. (In this case, the color on the patch is black rather than the brown hues associated with oxidized degradation products.)
- There is no such thing as varnish in your oil. Varnish is defined as oil-derived deposits. If it is dissolved back into the oil, it is no longer varnished, as it has transitioned back to oil degradation products.
The Aniline Point
Group II basestocks are said to have less solvency than Group I basestocks. The test most often used to measure this is Aniline Point (ASTM D611), which gauges the solvency properties of lubricating oils. It refers to the minimum temperature at which a specific volume of aniline (a polar aromatic amine) will completely dissolve in a given volume of the lubricating oil to form a clear, homogenous solution under specified test conditions. A lower Aniline Point suggests that the lubricating oil has a higher aromatic content and, hence, a higher solvency capacity. Conversely, a higher Aniline Point denotes lower aromatic content and solvency.
Here are some average aniline points for various base stocks:
Naphthenic 58 °C
Group I 100 °C
Group II 116 °C
Group III 125 °C
Group IV 127 °C
Alkylated Naphthalene 42 °C
Polyalkylated Glycol -20 °C
However, understanding the solubility of oil degradation products is more involved than simply understanding the oil’s ability to dissolve a polar constituent. It depends upon the chemistry of the degradation products and the characteristics of the oil. Polarity is just one of the parameters. A more complete understanding of the solubility of oil degradation products can be determined by studying the Hanson Solubility Parameters.
What are Hansen Solubility Parameters?
Hansen Solubility Parameters (HSP) provide:
- A numerical representation of the molecular interactions in solutions.
- Enabling a more robust understanding of solubility.
- Miscibility.
- Dispersion phenomena.
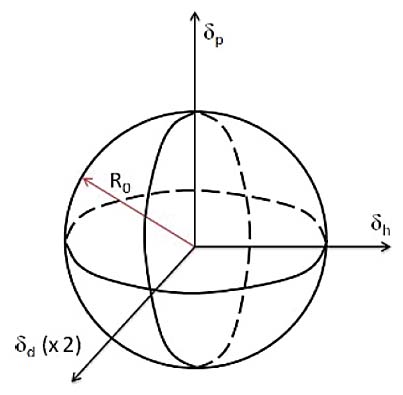
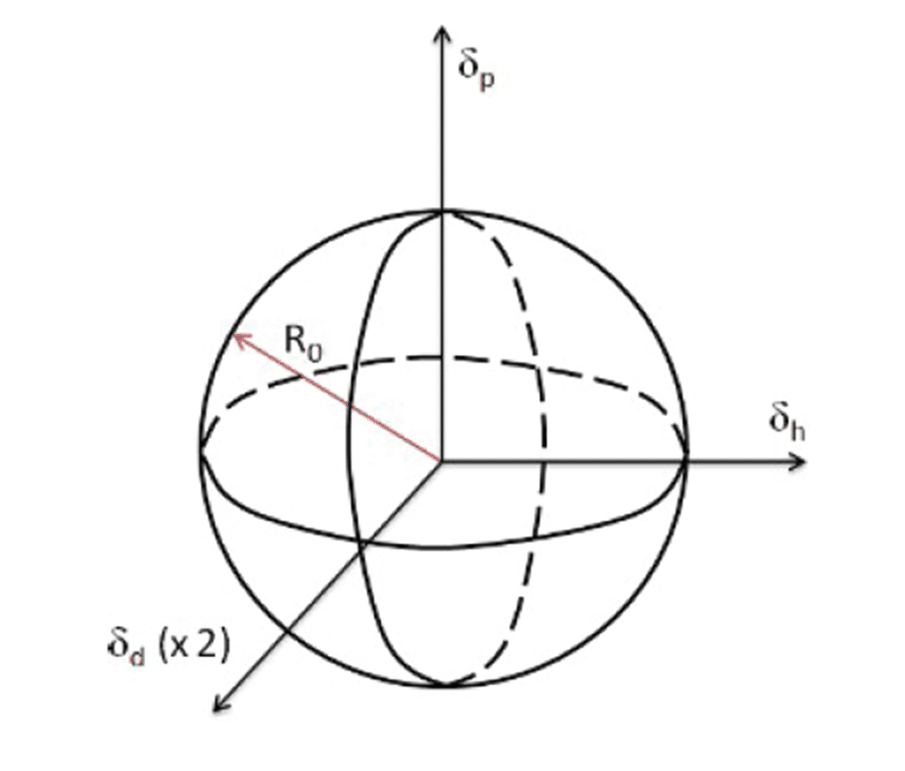
They are three values derived from a particular material’s dispersion forces, polar forces, and hydrogen bonding interactions. The three parameters are often represented as a three-dimensional coordinate (D, P, H), each depicting different forces as outlined below:
- Dispersion Forces (dd):
This parameter represents the interactions due to van der Waals forces among molecules. It quantifies the non-polar interactions in a substance, often related to the London dispersion forces resulting from instantaneous dipole moments within molecules.
- Polar Forces (dp):
This parameter accounts for the dipolar interactions within and among molecules. It quantifies the polar interactions in a substance that arise due to permanent and induced dipoles.
- Hydrogen Bonding Forces (dh):
This parameter represents the potential for hydrogen bonding within a material. It quantifies the interactions arising from hydrogen bonding, a specific dipole-dipole interaction between hydrogen atoms and electronegative atoms like oxygen or nitrogen.
One can predict whether the solute would dissolve in the solvent by analyzing the Hansen Solubility Parameters of a solute and a solvent. Materials with similar HSP values are likely to be miscible or soluble with one another. This set of parameters can be applied to predict when oil degradation products may no longer be dissolved in oils, or when varnish can be redissolved back into the oil.
Moreover, HSP values can be graphically represented in a spherical three-dimensional Hansen Space to visualize the solubility and miscibility relationships among various materials. This is a powerful tool to develop solubility enhancers to manage oil degradation products.
If the chemistry of the degradation products, as defined by D, P, and H, creates an area inside that defined by the lubricant, the degradation products will dissolve. If it is outside the area, it will not dissolve.
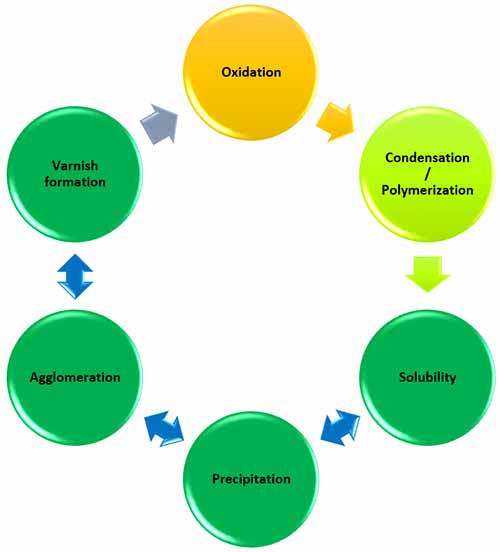
Oil degradation products are soluble. This means that they can easily transition in and out of solution based on the equilibrium between the solute (varnish) and the solvent (oil) as seen in the varnish lifecycle in Figure 2.
The solubility of oil degradation by-products is significantly influenced by temperature. Analogous to the enhanced solubility of sugar in hot water as opposed to cold water, a rise in temperature increases the solubility of varnish in lubricating oil.
Technically, this is due to the elevated kinetic energy of molecules at higher temperatures, which facilitates the overcoming of intermolecular forces that otherwise impede solubility, thereby enabling the dissolution of more varnish.
Conversely, as the temperature diminishes, the kinetic energy of the molecules decreases, lessening the oil’s capacity to maintain the varnish in a dissolved state. This thermodynamically driven reduction in solubility during cooling promotes the precipitation of varnish from the solution, leading to its deposition on the internal surfaces of the equipment.
This phenomenon underscores the crucial role of temperature management in mitigating varnish-related complications in lubrication systems.
The Sandpaper Effect
Varnish can be complex structures of oxidation products and insoluble contaminants, such as wear metals and dirt. (In the strictest sense, even wear metals and dirt can dissolve in the lubricant under the right conditions, like water dissolving rocks as a river flows over them.)
Dr. A. Sasaki described this phenomenon as the Sandpaper Effect. The sticky nature of the oxidatively-derived varnish may allow suspended particles to stick to it, becoming trapped in the varnish. This type of varnish layer forms asperities on the surface.
Thus, when other surfaces encounter this type of varnish, they are susceptible to wear. This leads to the sandpaper effect, which ultimately damages the internals of the equipment, especially close tolerance components such as valves.
What Is the Role of Solubility Enhancers?
Solubility Enhancers can be a powerful technology to manage oil degradation products. They may be used to prevent oil degradation products from coming out of solution to form deposits or to dissolve varnish and keep it back in solution.
For a Solubility Enhancer to be deemed an effective solution, it should meet the following conditions:
- Miscible in lubricant – this will allow it to be added to an in-service lubricant during machine operation without specialized blending equipment.
- Wide range of compatibility – this extends to both in-service oils and system materials such as seals and paints
- No impact on an in-service oil’s characteristics – it should not interfere with the oil’s ability to interact with contaminants such as air and water. This can severely impact the oil’s air release, foam, and demulsibility characteristics.
- No impact on surface-active additive ingredients – this could potentially interfere with an oil’s corrosion inhibitors, antiwear, extreme pressure, or friction modifier additive systems.
- Engineered to solubilize oil degradation products effectively – this can give them the ability to hold a large amount of degradation products without the concern of these precipitating out under oxidative stress.
- Ability to work effectively without a varnish mitigation technology installed. This enhancer should ideally stand on its own.
- Ashless technology should be formulated without additive metals to ensure that it doesn’t contribute to varnish formation even under the most extreme oxidative conditions and without antioxidants.
Ideally, a solubility enhancer should add value to a system by removing varnish or keeping oil degradation products in solution without compromising the integrity of the lubricant or system.
Solvancer® – the Solubility Enhancer of the Future
Solvancer (a patent-pending technology) was developed using a blend of specialized synthetic API Group V chemistries. This technology has outstanding solubility characteristics and is compatible with many base oils and fully formulated lubricants.
It doesn’t impact system materials such as seals, filters, or paint and has excellent oxidation stability and long-term deposit control characteristics. Solvancer does not cause any adverse impact on fluid properties, nor does it use surface-active chemistry.
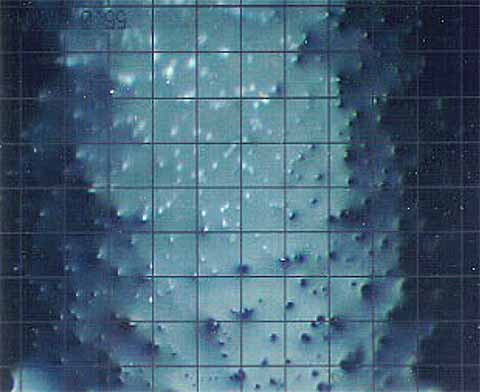
Solvancer was used in these two applications below, and the MPC results are definitive.
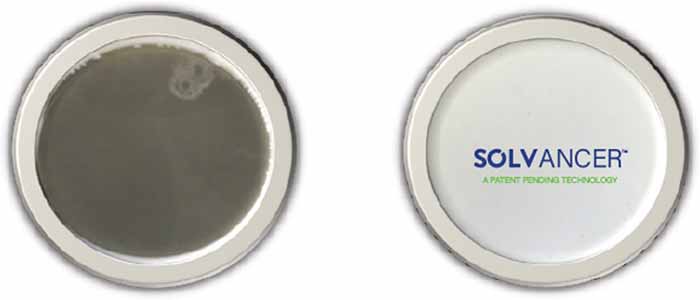
For this first example, 5% of Solvancer was added to a PAO Compressor oil, and the MPC value was lowered from 48 (patch on the left) to 6 (patch on the right).
In this second example, Solvancer was added to a Group II-based Air compressor lubricant, and the MPC value was lowered from a rating of 67 to 11.
Not All Oil Soluble Cleaners are Created Equally.
There are now multiple oil-soluble cleaners available in the market. These chemistries may effectively dissolve varnish immediately before an outage to prevent system decontamination or oil flushing between oil exchanges. However, some chemistries may have unintended consequences if left in the system for too long.
To estimate the long-term performance of different solubility enhancers, they were mixed with new oil and subjected to the oxidative stresses in the Turbine Oil Performance Prediction (TOPP) test. This test procedure stresses the oil according to ASTM D7873 for 12 weeks.
Although many physical and chemical tests are done throughout this experiment, simply looking at the patch and condition of the glassware after the experiment tells a powerful story. The comparison of DECON versus two other commercially available solubility enhancers can be seen below in Figure 6.
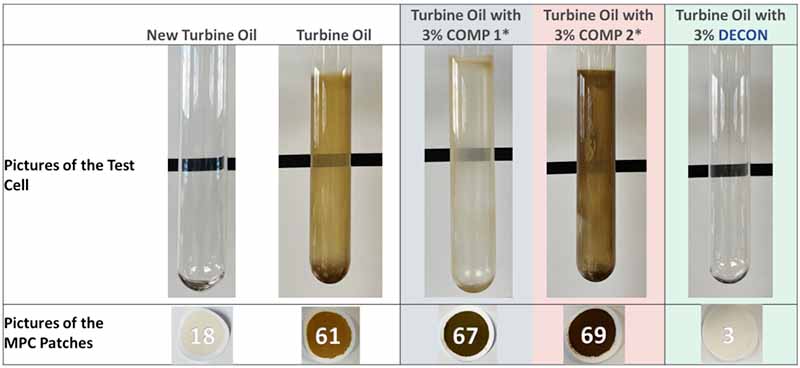
In this case, a new, untreated turbine oil sample produced heavy glassware deposits and an MPC of 61 after the test. The same turbine oil was treated with 3% of COMP I, COMP 2, and DECON. The DECON-treated fluid maintained deposit-free, pristine glassware and a low MPC value, as seen above.
It should be noted that COMP 2 produced even more deposits than the untreated sample. Performance tests such as this must be carried out before using oil-soluble cleaners beyond a short period, immediately before an outage.
Available Technologies
Solvancer was formulated by utilizing Hansen’s Solubility Parameters to ensure the technology is optimized for long- and short-term deposit control. The technology allows deposits to remain in solution, even when the oil cools. It is incorporated into the following Fluitec products to provide deposit control:
- DECON, DECON AO, DECON AW
- Infinity Turbine Oil
Ideally, one must first understand their solubility when determining methods for managing oil degradation products. As outlined in this article, the answer does not lie in one simple test but rather in further exploration of the actual characteristics of the varnish and the system in which it is being produced. Solubility enhancers can be optimized for deposit control where they do not compromise the other characteristics of the oil.
Authors
Greg Livingstone is Chief Innovation Officer for Fluitec. He has three decades of industrial lubrication experience focused on how lubricants degrade and to mitigate the risks associated with oil failure. He’s developed oil analysis tests, filtration technologies, solubility enhancers and other technologies used to increase the life and performance of industrial lubricants. He has volunteered in multiple industry organizations, such as STLE, ICML, and ASTM. Along his journey, he’s published over 70 papers on these subjects and has helped hundreds of clients in over 50 countries.
Sanya is the Founder of Strategic Reliability Solutions Ltd based in Trinidad and operates in the capacity of Managing Director and Senior Consultant. She works with global affiliates in the areas of Reliability and Asset Management to bring these speciality niches to her clients. She holds her BSc in Electrical and Computer Engineering, MSc in Engineering Asset Management and is an ICML certified MLE (Machinery Lubrication Engineer) – the first female in the Caribbean. Sanya was also the first female in the world to achieve the ICML Varnish badges (VIM & VPR). She is the author and co-author of three books; Lubrication Degradation Mechanisms, A Complete Guide, Lubrication Degradation – Getting into the Root Causes and Machinery Lubrication Technician (MLT) I & II Certification Exam Guide. Recently, she also edited the book, Empowering Women in STEM – Personal Stories and Career Journeys from Around the World. When not writing or managing the business, you can find her supporting projects to advocate for women in STEM.
While temperature is widely accepted as one of the primary factors contributing to oil oxidation and degradation, we set out to better understand the effects of temperature on the rate of oil degradation and deposit formation. This presentation reviews the test results of several commercially available turbine oils aged under different temperature regimes.
Although there are multiple degradation pathways a turbine oil faces when placed in operation, the dominant failure mode is oxidation. By analyzing a turbine oil placed under accelerated oxidation conditions in a laboratory, much can be learned about how that oil will perform when placed in service. While temperature is widely accepted as one of the primary factors contributing to oil oxidation and degradation, we set out to better understand the effects of temperature on the rate of oil degradation and deposit formation. This presentation reviews the test results of several commercially available turbine oils aged under different temperature regimes.
Speakers: Elona Rista, Product Support Manager, Solar Turbines
This program consists of the specification of requirements for the new turbine oil, a well-proven monitoring program and the improvement measures derived from this. This presentation will be an overview of our experience with the above Siemens Energy program.
The performance and quality of the turbine lube oil is critical to ensuring the reliability of our turbomachinery. Siemens Energy has implemented a thorough and reliable process to ensure that the turbine lubricating oil performs as required.
Speakers: Dr. Ludger Quick, Chemist, Siemens Energy
WESTO specialises in all matters of oil maintenance and has extensive expertise in the field of varnish removal. WESTO uses the ESP resin agglomeration process of FLUITEC and OELCHECK lubricant analyses.
Correlating MPC-RULER® under laboratory oxidative conditions
Considering that the varnish potential of an oil is measured by the MPC protocol it is relevant to establish correlations if any between RULER trends and MPC trends for a variety of commercially available formulations under laboratory conditions.
Antioxidants are used to protect lubricating oils from the deleterious effect of oxidation. These include increase of acid number, the formation of deposits, and possibly viscosity increase. Considering that the varnish potential of an oil is measured by the MPC protocol it is relevant to establish correlations if any between RULER trends and MPC trends for a variety of commercially available formulations under laboratory conditions.
Speakers: Dr Cristian Soto, Chief Operations Officer and VP of R&D Fluitec
In this presentation we will present different case studies where both methods (Preventive and Corrective Maintenance) have been applied in Qatar, onshore and offshore.
Qatar, a peninsula in the Persian Gulf is vulnerable to extremely stressful ambient working conditions; primarily high temperature and humidity. Under these conditions, both oxidative and thermal degradation can happen simultaneously and consistently in lubricants of turbo machinery / critical rotating equipment, which can be the main causes of oil degradation. Condition Monitoring and Maintenance Management are holistic multi-discipline based approaches which provide significant improvements in efficiency of rotating machinery and hydraulic systems, increasing their availability, and directly enhance profitability. There are two traditional methods of carrying out maintenance of a company’s machinery: Preventive and Corrective.
Which one is applied by your company? Do your customers know the advantages of one over the other? Which one do they prefer? In this presentation we will present different case studies where both methods have been applied in Qatar, onshore and offshore.
Speakers: Vanda Franco, Associate Manager – Operations, Petrotec – Team Services and Rentals
Have you ever had to shut down equipment because there was varnish in your system? These shutdowns can be quite costly especially if you’re dealing with critical equipment. Gearboxes and heavy duty systems are no exception. The shutdown of a heavy duty system can take a longer time to get back online due to their complexities and safety risks involved with these types of equipment. This is one of the main reasons why we’ve created DECON HD, ideally suited for systems utilizing ISO 150-320 grades of oil.
DECON HD is part of the DECON family and is engineered with Solvancer® (a patent pending technology). It has been designed to decontaminate systems and protect the oil from forming varnish while providing long term deposit control. It can make an immediate impact on a system and dissolve varnish which can lead to rapid reduction in temperatures and possibly avoiding an unplanned shutdown. Before getting into more details about DECON HD, let’s take a step back and find out more information about the entire family.
The DECON Family
The DECON family consists of four products which all carry Solvancer as the main ingredient. What sets these products apart is their applications to various situations. Let’s take a closer look at their differences below:
- DECON – This is the main product and can be used in any system to decontaminate it and help keep deposits in solution. Ideally, its treat rate is between 3-5% and should be used for applications utilizing grades of ISO 100 or lower.
- DECON HD – ideally suited to decontaminate systems using ISO 150-320 This has a higher treat rate of 6-10% (due to the viscosities involved). Typically, these types of viscosities are found in industrial gearboxes.
- DECON AW – Hydraulic oils need to be clean due to the tight tolerances but they also undergo a lot of wear. Hence the antiwear property usually diminishes very quickly in some hydraulic oils. DECON AW is suited for hydraulic systems experiencing high levels of varnish and wear. It keeps the deposits in solution while also adding another level of protection with the antiwear properties. Usually, a treat rate of 3-5% is used in this application.
- DECON AO – Most oils undergo oxidation which in turn produces deposits. During this process, the antioxidants often become depleted and the base oil can undergo degradation. DECON AO was designed to prevent long term deposits and replenish antioxidant levels in the oil. This typically uses a treat rate of 3-5%.
The DECON HD Specifics
DECON HD is a blend of Group IV and V chemistries with a flash point of 216°C. It has a Risk Free Guarantee to have no compatibility impact on the chemistry of the in-service oil such as the demulsibility, air release or foaming characteristics. In fact, it can rapidly reduce the oil’s varnish potential, has excellent oxidation stability and deposit control characteristics. This makes it ideal for heavy duty systems experiencing challenges with deposits.
FAQs
Here are some Frequently Asked questions about DECON HD:
How does DECON HD work?
DECON HD has been formulated with Solvancer®. This patent pending technology is solubility enhancing which gives DECON HD its properties. Solvancer has been engineered for non-detergent, API Group I-IV based lubricants. It is an API Group V synthetic oil which is miscible in lubricants and does not affect the additive system’s functionality.
When DECON HD is added to the system, it rapidly dissolves varnish from the machine using the enhanced solubility properties of Solvancer.
Is DECON HD compatible with other oils / products?
Yes it is! DECON HD is made with an API Group V synthetic oil which is miscible in lubricants. It also doesn’t affect the additive system’s functionality. It does not impact system materials such as seals, filters or paint.
Can DECON HD be used for different viscosity oils? Will it affect the viscosity of the current oil?
DECON HD is specifically designed for ISO 150-320 grades. Since this is typically added at a ratio of between 6-10%, it does not significantly affect the overall viscosity of the oil.
Where does the varnish go?
DECON HD is formulated with Solvancer. Solvancer is responsible for keeping the varnish in solution. This is based on Hansen’s solubility principle that “like” dissolves “like”. Oil degradation products are more polar than the non-polar state of the lubricant which derived them. The Hansen Solubility parameters model polarity, hydrogen bonding and dispersive forces on a 3 dimensional axis forming the Hansen Sphere. The effectiveness of solubility enhancers are defined by a sphere with a radius which encompasses oil degradation products. Once the properties of the varnish-causing contaminants reside in the sphere, they will effectively dissolve.
We must also remember the lifecycle of varnish, there is a double arrow between the solubility-precipitation-agglomeration-varnish formation steps. This indicates that even though varnish may be formed, it can be solubilized and return to its original solution. These reactions are reversible. This is how the varnish is returned to the oil in a soluble form through the use of DECON HD.
How long do I need to leave DECON HD in my system?
Typically, DECON HD has shown results within 24 hours of its addition to the system. There have been applications which took one month to see the decontamination of their system. This rate of results will differ depending on the amount of varnish present in the system and the treat rate of DECON HD. It’s best to contact one of Fluitec’s reps to allow them to properly assess your system and then make determinations on the ratio required.
Usually, DECON HD may be added to systems as a way of removing all the varnish before a system shutdown. This ensures that the system is clean and ready for the new fill of oil. It can also be used to prevent a shutdown of equipment due to large accumulated amounts of varnish. DECON HD can remain in the system and it will not negatively impact the function of the oil.
Is there a ratio to add DECON HD to the system?
The usual treat rate for DECON is between 6-10%. These treat rates have been used successfully on varying types of varnish in many systems and we have seen the systems being cleaned.
It’s best to contact one of Fluitec’s reps to allow them to properly assess your system and then make determinations on the ratio required.
Can DECON HD be used in new oil?
While DECON HD is usually used in oil which has been in the system for some time, it can also be added to new oil as it does not impact the properties of the oil. Its purpose is to dissolve any varnish which is formed by the oil.
Are there any implications of DECON HD traces remaining in the equipment?
DECON HD is usually added at a treat rate of 6-10% of the system’s volume. Thus if the system is drained, there is a very low probability that traces of DECON HD will remain in the equipment at high concentrations. Additionally, DECON HD is highly compatible with lubricants as well as materials within the system. Hence, if any traces of DECON HD remain in the equipment, there should be no compatibility issues with the lubricant being added to the equipment.
Can DECON HD be used in any industry?
DECON HD can be used once there is varnish in a lube system which uses oil within the ISO 150-320 grade range. This applies across industries however, there may be restrictions in the Food and Beverage or environmentally aware industries where spillage into the environment may be a concern. These can be guided by the regulations for these industries.
Can DECON HD be added to the system more than once?
Typically, DECON HD is added at a treat rate of 6-10% and its effects on the system are monitored. Should the need arise to add DECON HD a second or third time, a Fluitec rep should be contacted.
Please reach out to your Fluitec Rep if you have additional questions.
Greg Livingstone, Chief Innovation Officer at Fluitec International
Many companies utilizing rotating equipment have initiated or planned to create decarbonization strategies. The process reduces and compensates for the emissions of carbon dioxide equivalent (CO2e), ultimately down to “Net 0”.
Lubricants are an essential component in rotating equipment, so it makes sense to determine optimum ways of managing these fluids in the most sustainable way possible, which includes enhancing their performance.
Life Cycle Assessment (LCA) is a methodology for assessing environmental impacts associated with all the stages of the life cycle of a product1 and is the accepted tool to analyze the potential environmental impacts of products.
It is, therefore, the optimum tool for measuring the sustainability of a lubrication program and comparing various products and strategies. Performing an LCA is defined in ISO 14040. It takes a thorough inventory of all the materials and energy required to make a product, calculating a cumulative potential environmental impact.
This calculation assesses midpoint indicators, such as stratospheric ozone depletion, acidification, eutrophication, water scarcity, and toxicity potential. Still, this article will focus on Global Warming Potential measured in CO2e.
LCA is a helpful tool for a variety of purposes. For example, how do you know if an electric vehicle will lower emissions more than an internal combustion vehicle? What if the electric vehicle gets its power from a coal-burning power plant?
Doesn’t mining lithium and manufacturing batteries produce a lot of emissions? This question has many complexities, and the answer would only be possible by performing a cradle-to-grave LCA. (Incidentally, there are many studies on this, and electric vehicles significantly reduce emissions over the vehicle’s life2.)
Cradle-to-Gate vs Cradle-to-Grave
When performing an LCA on a lubricant, one can look at various product life stages. Cradle-to-Gate represents the carbon impact of a product from its inception to the moment it is ready for sale. This is the most common LCA done on lubricants, as manufacturers do not have control over the use of the product once it is sold.
Cradle-to-Grave also covers the product’s use and how it is treated at the End of Life. Fig. 1 illustrates these stages and identifies the difference between “cradle-to-gate” and “cradle-to-grave.”
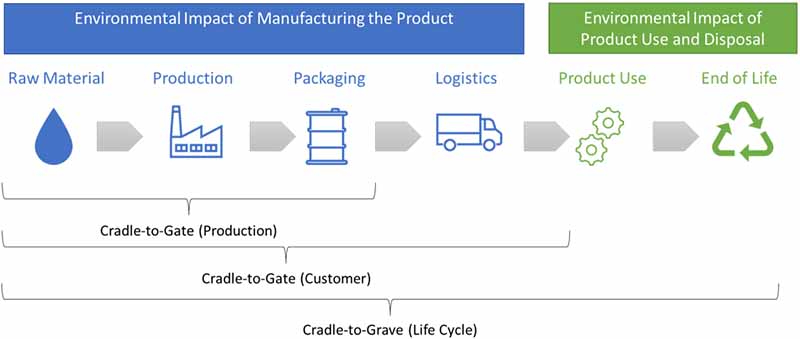
The CO2e contribution of extracting, refining, and blending the crude oil (cradle-to-gate) makes up a smaller value of greenhouse gases compared to its End of Life (cradle-to-grave)3.
Although antioxidants have approximately twice the carbon footprint of mineral oil, they contribute a relatively small amount to the overall total since they are used at a small percentage in the formulation4.
Depending on what part of the world the used oil is generated, the contribution of CO2e at the End of Life is defined by what percentage is incinerated or re-refined. Different base oils may also contribute more CO2e to the overall product.
For example, Polyalphaolefins (PAOs) have about twice the cradle-to-gate CO2e footprint as mineral oils. However, the End-of-Life of both products is the same representing a more significant percentage.
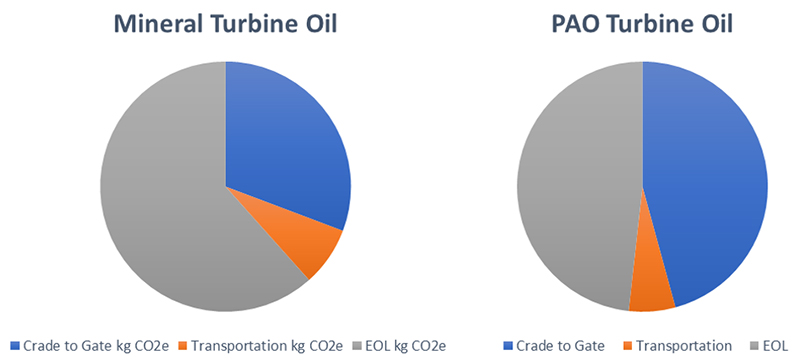
The overall CO2e contribution of a mineral turbine oil versus a PAO turbine oil is illustrated in Figure 2. Therefore, an effort to extend the life of in-service oil will significantly impact lowering the total carbon footprint of a lubricant.
It is also interesting to note that transportation plays a minor role in the overall carbon footprint. This is the case as long as lubricants are not being flown around the world.
Comparing Lubricant Sustainability
Many factors go into measuring the sustainability of a lubricant. Figure 3 illustrates these various factors and pathways to make the lubricant more sustainable.
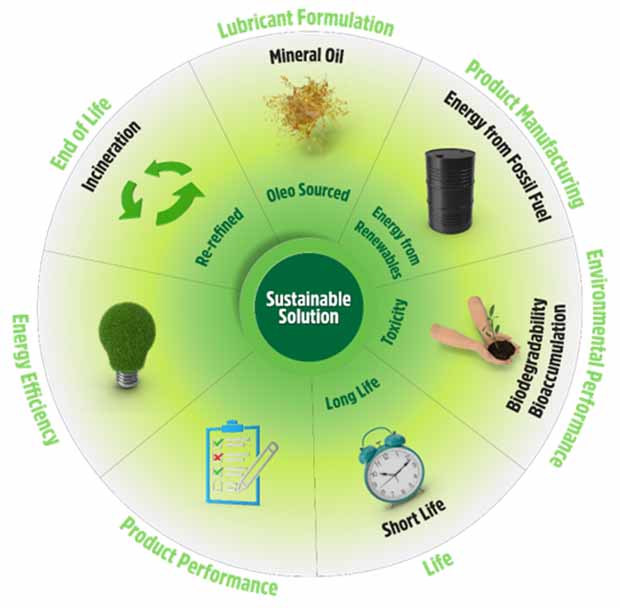
Using a comparison like this, it is possible to compare the sustainability of various lubricants and lubrication practices. Remember that each category can be converted to kg CO2e, except for environmental performance, which is its own category.
Biodegradability performance, bioaccumulation results, and the oil’s toxicity rating are essential aspects of the sustainability of the oil. Still, those qualities must be directly compared since they are on different scales.
Based on this spectrum, the ultimate sustainable lubricant would be plant-based (oleo sourced) and made from renewable energy; one which is readily biodegradable, non-toxic, and doesn’t have bioaccumulation; one which provides a long service life and improves the energy efficiency of the system it is lubricating; and finally at the end of this ideal fluid’s life, it is re-refined or re-used in another application.
Also, for a sustainable lubricant to be practical, it needs to be fully compatible with the application, including materials of construction and contamination ingression. For example, an oleo-based ester may tick all the boxes but may shrink system seals and hydrolyze due to high water contamination, making it unsuitable for a specific application.
Lubricant Sustainability Case Studies
Following are three examples of comparing the sustainability of different lubricants by using LCA. The examples illustrate that the product with the highest cradle-to-gate carbon footprint is not necessarily the one with the lowest carbon footprint once a cradle-to-grave analysis is completed.
Example 1: Group II Engine Oil versus Longer-life PAO Engine Oil
Producing PAO-based engine oil is approximately 40% more carbon-intensive than Group II-based engine oil.
For this example, we’ll assume a typical engine oil formulation with the following ingredients5:
- 80% Base Oil
- 2% Detergents
- 6% Dispersants
- 9% Viscosity Modifiers
- 1% Antioxidants
- 2% Antiwear
The difference in these comparative formulations is using a PAO synthetic oil instead of mineral oil (80% of the formulation). Let’s assume both formulations produce the same mileage; the only difference is that synthetic oil will last twice as long. The LCA calculations are below in Figure 4.
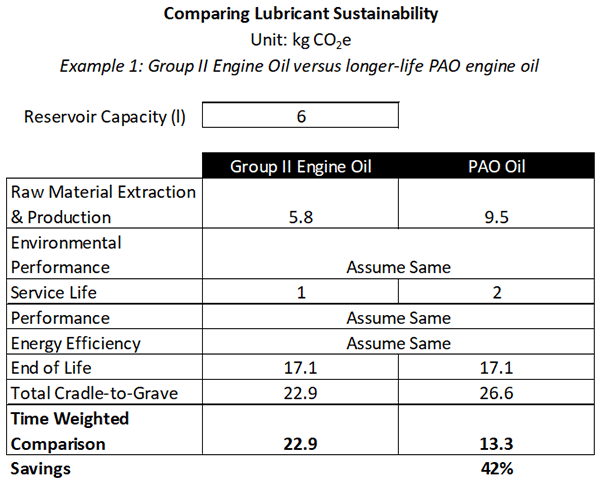
The LCA values for the Cradle-to-Gate4 and Gate-to-Grave6 are used from published LCA source material. The PAO-based engine oil is approximately 63% more carbon-intensive to produce than the Group II engine oil.
However, if one assumes that the PAO product will last twice as long, its total carbon footprint is 42% lower than the Group II formulation. This is a good example showing the importance of performing a cradle-to-grave LCA to differentiate between the sustainability of different products.
Example 2: Re-refined Hydraulic Oil Versus an Energy Efficient Hydraulic Oil
There have been a lot of studies on the use of energy-efficient hydraulic oils and their impact on power consumption7,8. For this example, we’ll compare a conventional hydraulic oil using a re-refined base stock to an energy-efficient formulation. The estimated cradle-to-gate carbon footprint for these two products is below:
- Re-refined hydraulic oil: 0.63 kg CO2e/kg9
- Group II, High VI, Energy Efficient hydraulic oil: 1.06 kg CO2e/kg5 (Assumes 8% viscosity index improver in addition to antioxidant and antiwear additives.)
At first glance, the energy-efficient hydraulic oil requires approximately 68% more carbon to produce. However, by using LCA, we can better evaluate the performance of the two products throughout their life cycle to provide a fairer comparison.
For this example, a Milicron® plastic injection molding machine (3,000 US tons; 230000; Performance Model) was used, containing 590 gals of hydraulic oil. To compare the energy efficiency of the two products, Mobil®‘s Industrial Hydraulic Oil Productivity Calculator was used.
View an example of this calculator in the State of Pennsylvania Energy Efficiency Technical Reference Manual, under the chapter “Energy Efficient Industrial Lubricants: Reducing Energy Consumption with Industrial Lubricants”10.
Assuming the Energy Efficient Hydraulic Oil decreases power consumption by 3%, below is an example of Mobil’s calculator determining power usage.
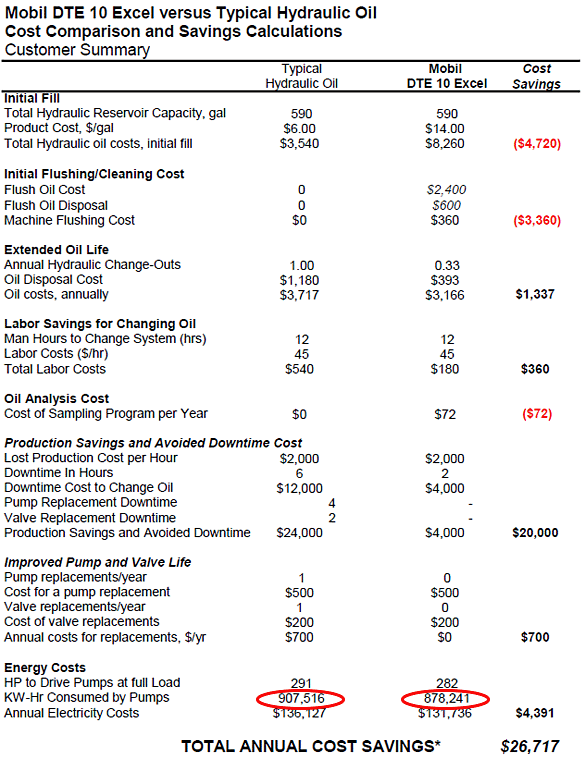
The model calculates that an energy-efficient hydraulic oil formulation with a 3% efficiency improvement will reduce energy consumption by 29,125 kW-hr a year. We can then convert the kW to CO2e using EPA’s online calculator11.
Another benefit of upgrading to an energy-efficient formulation in this application is a minimum service life extension factor of 3X. These calculations can now be put into an LCA comparison, as seen in Figure 6.
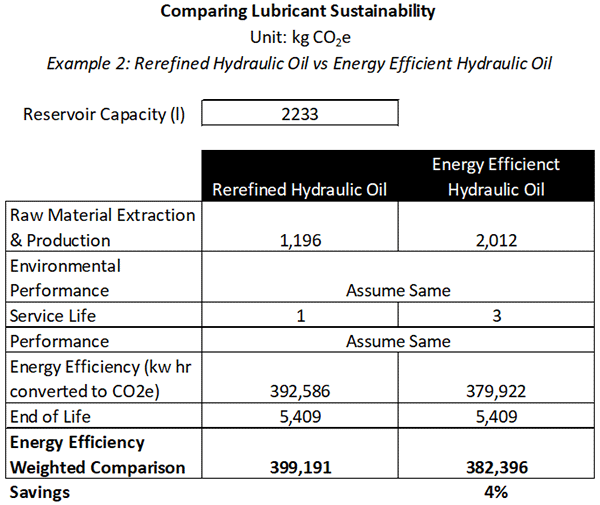
This calculation determined that the energy-efficient formulation reduced the overall carbon footprint by 4%. Although this doesn’t seem significant, this equates to almost 12,000 kgs per year of avoided CO2e emissions in one machine.
When one considers the thousands of plastic injection molding machines in use, the carbon footprint impact of using an energy-efficient hydraulic oil is significant.
This is a good example to illustrate that the performance improvements offered by new lubrication technologies may far outweigh their extra cradle-to-gate carbon footprint.
As can also be seen from the Mobil calculator, even though energy-efficient formulations are more expensive to purchase, they also provide a significant return on investment. LCA can be considered the sustainability version of Total Cost of Ownership.
Example 3: Avoiding a “Varnish Flush” in a 5,000 Gallon Gas Turbine
Maintaining a turbine oil with low varnish potential has many financial benefits for a power plant. In addition to increased availability and reliability, one may avoid doing a “varnish flush” between oil changes. Flushes are energy- and volume-intensive, accumulating a sizeable carbon footprint.
Fluitec invented a solubility-enhancing technology called DECON, which decontaminates lube oil systems between oil changes. Among other benefits, the technology allows rotating equipment users to avoid having to do a varnish flush between oil changes.
The following case examines the sustainability impact of adding 3% DECON to an in-service turbine oil to avoid having to perform an oil flush. In this example, we use a gas turbine oil with a 5,000-gallon reservoir and an eight-year life span.
The Fluitec Value Impact Calculator adds the cost and carbon footprint of adding DECON to the fluid and measures the value of not having to perform a flush during the following oil change. Review the results in Figure 7.
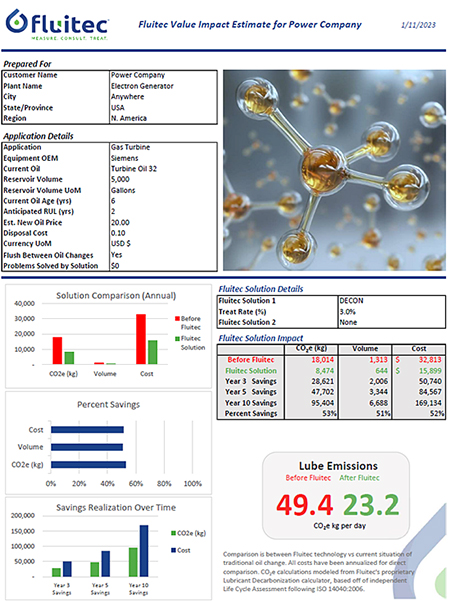
By using DECON and avoiding having to perform a lube oil system flush, this turbine can avoid generating 18 metric tons of CO2e per year. A calculation like this would be challenging without performing a cradle-to-grave LCA.
Other Strategies to Manage Oils in a More Sustainable Way
Multiple other lubricant management strategies can lower the carbon footprint of your lubricant program, including:
- Selecting the best-performing oil for your application resulting in longer drain intervals and lower maintenance costs.
- Implementing an oil analysis program to optimize the drain intervals of your oils. Keep in mind that not acting when oil analysis warrants it increases maintenance costs and dramatically increases your carbon footprint.
- Avoiding Varnish. In addition to failed components, deposits can create an insulating layer on bearing surfaces, resulting in higher temperatures and lowering the system’s energy efficiency.
- Extending lubricant life by additive replenishment. When done responsibly, this practice can double the life of your in-service oil, significantly lowering your carbon footprint.
- Re-refining an oil at the end of its life. Creating a circular economy with your lubricant at the end of its life by re-refining instead of incinerating will reduce the carbon footprint of your lubricant program.
- Minimizing contamination ingression. Studies have shown that contamination is responsible for as much as 70% of premature machinery failures. Deploying a solid contamination control program saves significant operational costs and reduces the associated carbon footprint.
As the saying goes, “If it doesn’t get measured, it doesn’t get managed.” In the case of achieving sustainable lubrication, using cradle-to-grave LCA principles allows you to measure and improve the sustainability of your lubricant program.
This article illustrates how to perform these calculations, and as the case studies showed, the initial carbon footprint of the lubricant does not necessarily mean decreased sustainability.
Conducting these LCA studies allows users to identify areas for improvement quickly and can quantify the benefits. These calculations can also shed some light on the practices which should be negated to assist in the decarbonization efforts, such as lube oil flushing, as illustrated in Case Study 3.
The carbon footprint of lubricants may seem small, especially if one does not consider “product use” in LCA equations. However, tribology, in general, can tremendously impact lowering society’s carbon footprint. A report to ARPA-E in 2017 calculated that 24% of energy could be saved annually through tribology efforts12. Measuring these efforts start with cradle-to-grave Life Cycle Assessments.
References:
[1] https://en.wikipedia.org/wiki/Life-cycle_assessment
[2] “A Global Comparison of the Life-Cycle Greenhouse Gas Emissions of Combustion Engie and Electric Passenger Cars” Bieker, G., ICCT, https://theicct.org/sites/default/files/publications/Global-LCA-passenger-cars-jul2021_0.pdf
[3] Cradle-to-grave LCA performed by Fluitec
[4] “LCA of petroleum-based lubricants: state of art and inclusion of additives,” A. Raimondi et al. The International Journal of Life Cycle Assessment, 17, 8, 987-996, 2012, DOI: 10.1007/s11367-012-0437-4
[5] “LCA of petroleum-based lubricants: state of art and inclusion of additives,” A. Raimondi et al. The International Journal of Life Cycle Assessment, 17, 8, 987-996, 2012, DOI: 10.1007/s11367-012-0437-4
[6] Wernet, G., Bauer, C., Steubing, B., Reinhard, J., Moreno-Ruiz, E., and Weidema, B., 2016. The ecoinvent database version 3 (part I): overview and methodology. The International Journal of Life Cycle Assessment, [online] 21(9), pp.1218–1230.
[7] Taylor, R.I. et al., “Lubricants & Energy Efficiency: Life Cycle Analysis.” Life Cycle Tribology, 2005.
[8] European Patent. International Application Number: PCT/EP2015/068272
[9] Fehrenbach, H. (2005), “Ecological and energetic assessment of re-refining used oils to base oils: Substitution of primarily produced base oils including semi-synthetic and synthetic compounds,” Institut für Energieund Umweltforschung GmbH (IFEU), a study commissioned by GEIR-Groupement Européen de l’Industrie de la Régénération.
[10] Young, J., Eriksen, E., Pennsylvania Statewide Technical Reference Manual – Work Paper: Energy Efficient Industrial Lubricants: Reducing Energy Consumption with Industrial Lubricants, https://www.puc.pa.gov/pcdocs/1687236.pdf
[11] https://www.epa.gov/energy/greenhouse-gas-equivalencies-calculator#results
[12] “Tribology Opportunities for Enhancing America’s Energy Efficiency,” A Report to the Advanced Research Projects Agency-Energy at the US Department of Energy, February 14, 2017

Greg Livingstone is Chief Innovation Officer for Fluitec. He has three decades of industrial lubrication experience focused on how lubricants degrade and to mitigate the risks associated with oil failure. He’s developed oil analysis tests, filtration technologies, solubility enhancers and other technologies used to increase the life and performance of industrial lubricants. He has volunteered in multiple industry organizations, such as STLE, ICML, and ASTM. Along his journey, he’s published over 70 papers on these subjects and has helped hundreds of clients in over 50 countries.
Greg Livingstone, Chief Innovation Officer at Fluitec International
In December 2015 at the Paris Climate Conference (COP21), the Paris Agreement came to life. This agreement is the first ever universal, legally binding global climate change agreement and was adopted by consensus by all members of the United Nations Framework Convention on Climate Change (UNFCCC). The Paris agreement outlines the global framework to limit global warming well below 2°C.
Currently, 197 countries have agreed to work towards reaching net carbon neutrality by 2050. Ideally, this should keep the temperatures below 1.5°C by the year 2100. However, as per the Global Climate Action Tracker released in May 2021, the current policies estimate that the levels can increase to a maximum of 3.9°C with a minimum of 2.1°C. With the pledges and targets, it is hoped to achieve an average of 2.4°C as seen in Figure 1 below.
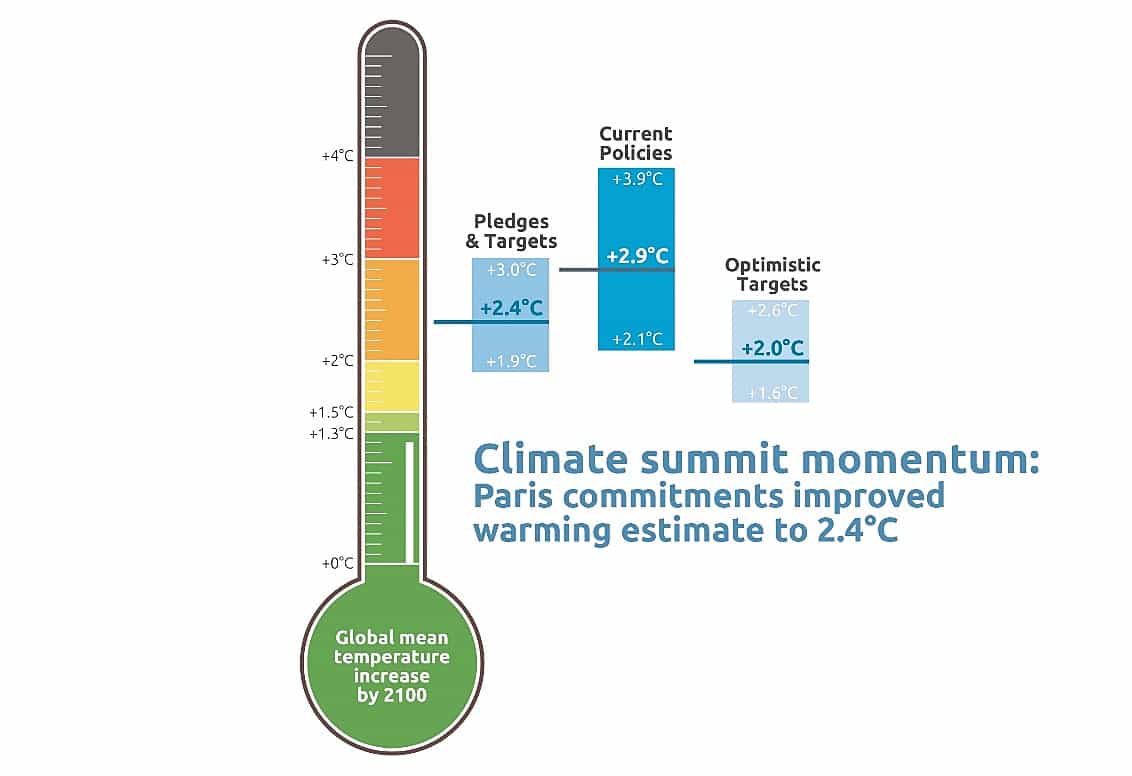
Figure 1: The Climate Action Tracker thermometer showing projected impact on temperature increases by 2100 based on Pledges and Targets, Current Policies and the Optimistic Targets scenarios. (Source: Climate Action Tracker, May 2021 Update).
What can the difference of 1°C indicate? As per Vitra Global, the last time the global average temperature was to 2°C warmer, the average sea level was over 6 meters higher than today. Thus, with a 3°C rise cities such as Miami, Shanghai, Osaka or Rio do Janeiro could sink underwater. This can potentially force 275 million people worldwide to relocate to escape flooding. Figure 2 shows the impact of the Paris Agreement on the estimated global temperatures from the Global Climate Tracker.
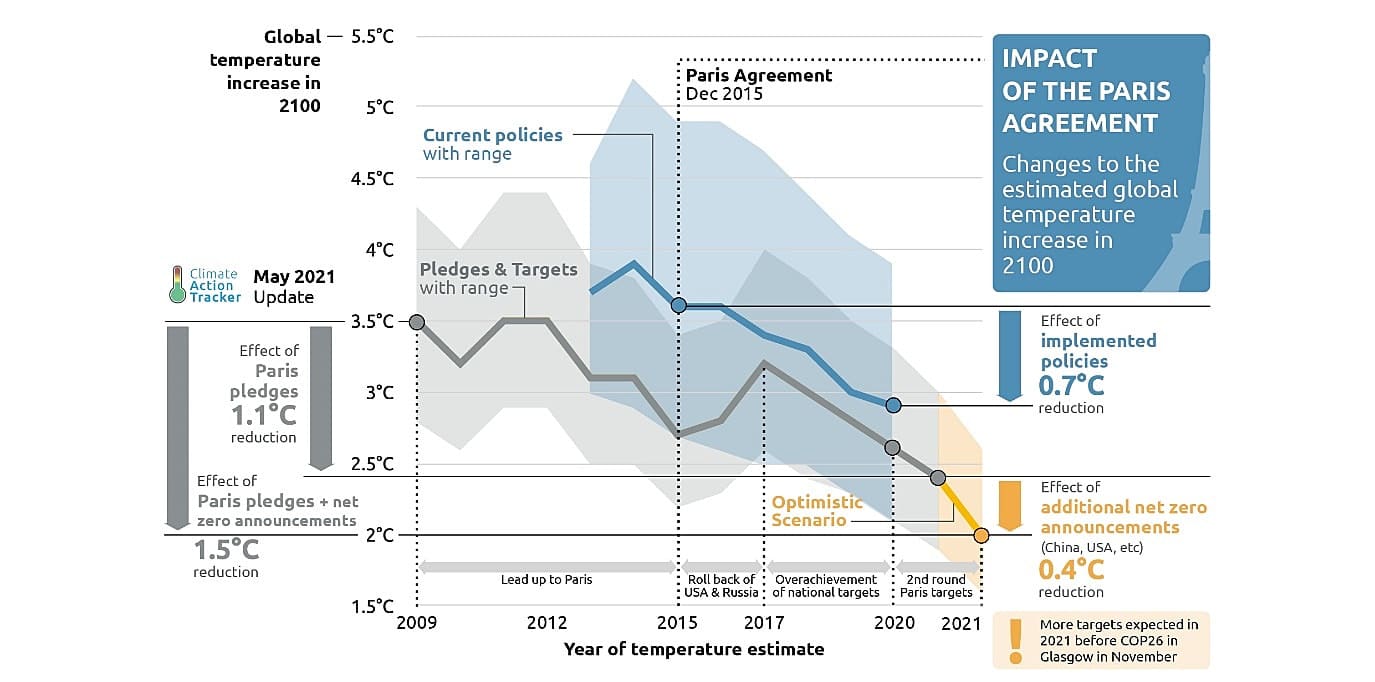
Figure 2: Impact of the Paris Agreement on the estimated global temperature increase in 2100. Figure shows the estimates of the Climate Action Tracker from 2009-2021 for its “pledges and targets” and “current policies” scenarios.
What is the role of the Industrial sector in Decarbonization?
Decarbonization is the process of reducing greenhouse gas (GHG) emissions. The most important gases which contribute to the GHG effect are Carbon Dioxide (CO2), Methane (CH4), Nitrous Oxide (N2O) and fluorinated gases. In the United States, CO2 emissions represent over 80% of U.S. manufacturing energy related GHG emissions as per the United States Department of Energy.
In September 2022, the United States Department of Energy released its Industrial Decarbonization Roadmap (DOE/EE-2635). It details Decarbonization pathways to Net-Zero Emissions by 2050 for Five Energy Intensive Industrial Subsectors namely; Chemicals, Refining, Iron & Steel, Food & Beverage and Cement & Lime. Figure 3 shows a breakdown of the percentage of Industrial MMT (Million Metric Tons) CO2 per sector.

Figure 3: Percent of Industrial MMT CO2. Data Source: “Annual Energy Outlook 2021 with Projections to 2050,” U.S. Energy Information Administration, Feb. 3, 2021. Note: The roadmap analysis covered only part of the chemicals (ammonia, methanol, ethylene, and BTX
Overall, industry represents 30% of U.S. energy-related CO2 emissions which translates to 1360 Million Metric tons CO2 (based on stats from 2020). The five highest sectors in which decarbonization can have the greatest impact account for 51% of energy related CO2 emissions in the U.S. industrial sector. This also represents 15% of the U.S. economy-wide total CO2 emissions.
There are four key technological pillars which can significantly reduce emissions for the five subsectors identified above. These crosscutting decarbonization pillars are; Energy efficiency, Industrial Electrification, Low-Carbon Fuels, Feedstocks and Energy Sources (LCFFES) and Carbon Capture, utilization and storage (CCUS) as shown in figure 4 below.

Figure 4: Strategies for Decarbonizing U.S. Industries.
Source: https://www.energy.gov/eere/doe-industrial-decarbonization-roadmap
How can sustainable lubrication help?
Based on all of the information seen thus far, it can be concluded that the industrial sector accounts for a fair amount of GHG emissions. In most of these industries, lubricants are used in both small and large quantities. Lubrication can significantly impact the overall efficiency of a machine if the right lubricant is being used while performing its function of reducing the coefficient of friction. The lubricant can also affect the energy efficiency of the equipment. In most cases, particular types of lubricants have shown considerably reduced power consumption. As shown in figure 5, Industrial Energy consumption contributes to 33% according to the U.S. DOE’s R&D Roadmap.
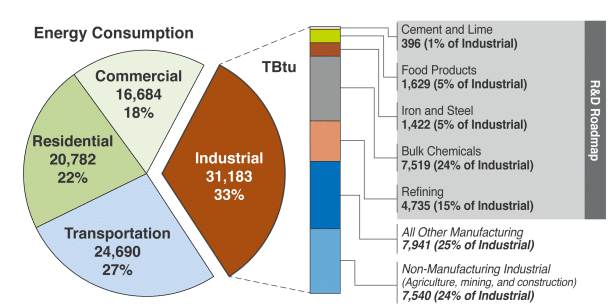
Figure 5: U.S. primary energy consumption by end use sector (left pie chart) and a breakout by industrial subsector (right stacked chart) in 2020. Offsite electricity losses (for the power generation sector) are allocated to end use industries. Source: U.S. DOE Industrial Decarbonization Roadmap.
Significant efforts are being made to increase the use of energy efficiency lubricants. Two roadblocks to widespread adoption include cost and the challenge of quantifying measurable improvements. Energy efficient lubricants typically cost more because they are made of tailored synthesized chemicals rather than straight hydrocarbon base oils. Generally, users are reluctant to purchase more expensive products unless there is demonstrable value.
One example is the use of multigrade hydraulic oils in industrial applications. Shear-stable polyalkylmethacrylate polymers are excellent viscosity index improvers and multiple studies have demonstrated energy efficiency gains of 5-15% compared to using monograde hydraulic oils. However, in most hydraulic applications, measuring these improvements is challenging without sophisticated equipment.
Another example exists in the turbine oil space. Mobil recently introduced a new turbine oil formulation that is 18cSt at 40oC rather than a standard ISO 32 VG which is 32cSt at 40oC. This was designed to meet GE’s new specification, GEK 121603. Mobil developed a mathematical model to measure efficiency improvements and then verified the measurements in test rigs and full-scale gas turbines. Compared to a standard ISO 32 VG formulation, the new formulation increases overall turbine efficiency by 0.09% due to reductions in bearing frictional energy loss. This small improvement in energy efficiency can translate to tens of thousands of dollars of fuel savings and a reduction of over 400 tons of CO2e annually. Measuring these energy efficiency improvements in the field remains a challenge but bearing and lube oil drain temperatures reductions at similar load and ambient conditions can confirm these improvements.
The road to lubricant decarbonization does not just lay with energy efficiency improvements. Significant efforts can be made to lower GHG emissions through the use of more sustainable lubricants and the implementation of sustainable lubrication practices. This approach often provides cost savings, and the environmental benefit can be quantified. There are three key activities for more sustainable lubrication include:
- Extending drain intervals
- Implementing sustainable lubrication practices
- Using lubricants formulated from renewable sources
Each of these practices allows accurate measurement of the environmental benefit using Life Cycle Assessment (LCA). Although LCA is a well-documented practice as defined in ISO 14040, there are still areas interpretation in performing LCAs on lubricants. To provide more clarity on performing LCAs, the American Petroleum Institute (API) is creating a technical report entitled, “Lubricants Life Cycle Assessment and Carbon Footprinting – Methodology and Best Practice”. Although this report is still in its draft form, it’s publication will improve the accuracy and consistency of performing LCAs on lubricants.
Fill4Life™ Lubricants – one pathway towards sustainable lubrication
Over 50 billion litres of lubricants are sold annually. Approximately half of this volume is formulated into engine oils and the other half is formulated into industrial lubricants. If only 1% of the industrial oils doubled their oil drain interval, this would equate to a reduction of over one million metric tons of CO2e per year.
This is one of the reasons why Fluitec has developed the concept of Fill4Life lubrication. This practice converts lubricants from a consumable into an asset. Like any other asset at an operating plant, the lubricant’s life is optimized rather than being treated like a consumable. Actively removing dead oil molecules while replenishing the lubricant with fresh additive components allows for the life of the oil to be significantly extended. Fluitec’s Solvancer® family of technologies have been formulated to optimize oil life and performance. For example, DECON AO was developed to deplete the sacrificial antioxidants in turbine and compressor oils. Long-term field studies have demonstrated DECON AO’s ability to more than double the life of in-service lubricants. The range of Solvancer technologies, including the world’s first Fill4Life turbine oil can be seen in Figure 6.
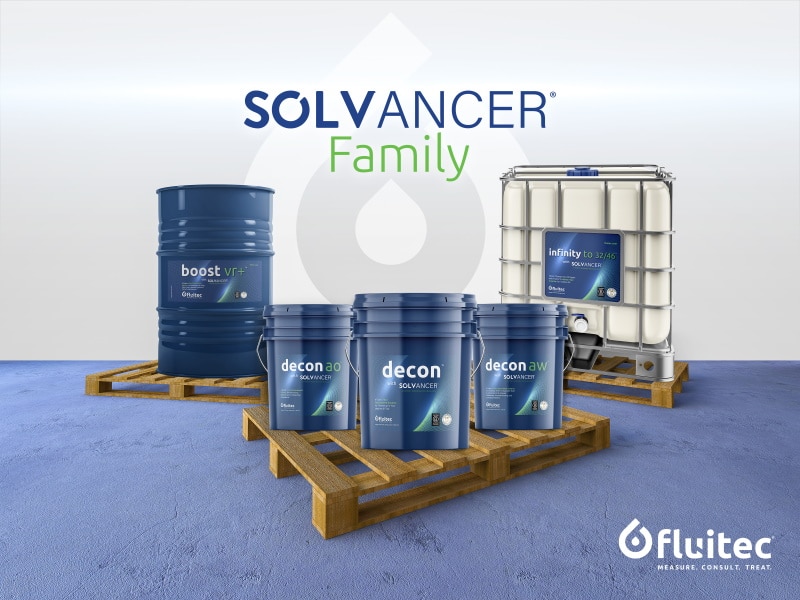
Figure 6: The Solvancer® family from Fluitec
The oil must be kept clean and free from moisture while maintaining a healthy balance of additives to increase its life span. Fluitec’s Electrophysical Separation Process (ESP) VITA units can assist in removing varnish related deposits from the oil. Furthermore, ESP removes some of the free radicals in the oil which consume antioxidants and can increase the life of the oil by >50%.
These solutions have been independently verified by the Solar Impulse Foundation, resulting in the Fill4Life solution being granted the exclusive Efficiency Solution award in 2019. Solar Impulse Foundation created this award for technologies that simultaneously address climate change while enabling economic growth. An independent Life Cycle Assessment demonstrated a reduction of >90% GHGs with Fluitec’s Fill4Life solution. In addition, average cost savings are over 60%. Fill4Life is at the intersection of sustainability and economics and represents a positive movement in the energy industry’s decarbonization efforts.
Overall, the drive towards lubricant decarbonization will only begin when there is a change towards more sustainable practices. This can be initiated by increased awareness of the environmental impacts of the various industries on the planet. The pathway towards keeping the temperatures below 1.5°C by the year 2100 can only be achieved if we all work together to help reduce our GHG emissions.
Published in Precision Lubrication, Dec, 2022
Quite often, when any type of deposit occurs in a lubrication system, the first assumption is that there is varnish in the oil. Typically, this is followed by the next assumption that oxidation caused this varnish. On the contrary, many types of deposits exist and each nature of deposit can be formed by many different methods of degradation. In this blog, we will take you through the methods of identification for thermal degradation and how these differ from those of Oxidation.
Thermal Failure – what is it exactly?
We are all familiar with the concept that for every 10°C rise in temperature, the life of the lubricant is effectively halved. In thermal degradation, something similar occurs. As the temperature rises, the energy contained in the molecules increases. Eventually, it gets to a point where the energy becomes too great and the bonds become broken. When this occurs the fluid’s properties are altered and the carbon-carbon bonds are broken which propagate through branching reactions. This accelerates the rate of thermal failure.
Some of the first changes which are noticeable in the lubricant are changes to the fluid’s odour and colour. We can also see changes to viscosity of the lubricant as well as depletion of additives. Lastly, we will also notice the formation of by-products which will eventually lead to sludge and varnish. Sludge is often less dense than varnish and often acts as its predecessor although it can have a higher water- moisture content compared to varnish. With elevated temperatures, sludge can be “cured” when its moisture evaporates and its density increases. This leads it to produce varnish.
When the bonds are broken during thermal failure, the lubricant can produce by-products which are of either a higher or lower molecular weight. The by-products of lower molecular weight are usually termed low boilers. These have the tendency to have a low flash point and in small concentrations, they can actually lower the flash point of the entire lubricant in the reservoir. Evaporation is also possible with these low boilers.
On the other hand, the high molecular weight by-products are often the precursors to varnish. These are typically polar in nature and tend to precipitate onto the di-polar metallic surfaces within the system. They can affect several of the lubricants properties including viscosity, foaming and demulsibility characteristics. Additionally, these high molecular weight by-products can cause interference with polar additives such as EP, AW and Corrosion Inhibitors.
When does thermal failure occur?
While some additives are designed to resist thermal failure, base stocks also have a role to play in resisting thermal failure. Traditionally, API Group I base stocks have a lower resistance to thermal failure compared to Group II & III which usually contain higher levels of aromatics and other impurities.
Let’s explore the ways in which thermal failure can occur:
- If there is a hot spot in the system which elevates the lubricant to a very high temperature causing localized thermal failure.
- Pressure Induced Thermal failure which occurs when there is the rapid adiabatic compression of air bubbles in a system that creates excessive high temperatures. This can cause thermal failure.
- Pressure Induced dieseling which occurs as a result of combustion of light end hydrocarbons. In this case, the phenomenon creates both extreme pressures and heat which can rapidly cause thermal failure.
- Static electricity can be generated between oil and mechanical filtration which can create high temperatures and free radical generation leading to thermal failure.
In thermal failure, chain propagation and branching reactions can form organic, soluble compounds. These processes typically repeat until insoluble species are generated forming polymers and other compounds of high molecular weight. These insoluble compounds are usually sticky and easily bond to particles, depleted additives and water.
Varnish will only form when the solubility limit for the high molecular weight insolubles is exceeded. One key factor to solvency of a lubricant is temperature. Some studies have shown that insoluble compounds are more resistant to dropping out of solution at temperatures above 68°C. This is one of the main reasons why varnish will begin to form in the cooler spots in the system first such as strainers. At extreme temperatures, thermal failure can produce black carbon particles which tend to fall out of the solution immediately.
Thermal Failure vs Oxidation
Before talking about the differences between Thermal Failure vs Oxidation, it is worthwhile to examine their similarities. Both mechanisms involve free radical chain proliferation and can effectively disrupt any system. These mechanisms can produce similar by-products although their final deposits can be very characteristic. Some of the analytical methods to identify whether either of these products are present are also the same.
On the other hand, the major differences between these two mechanisms can include;
- Thermal failure occurs in the absence of oxygen while oxidation requires the oxygen molecule as a catalyst for the reaction.
- Thermal failure can occur in the lubricant prior to the antioxidants being depleted.
- Thermal failure can happen before there are noticeable elevations in the acid number.
- Thermal failure can take place in new products which have been improperly stored.
Detecting Thermal Failure and Varnish Potential
One of the main challenges with trending thermal or oxidative degradation at the molecular level is that it is only possible to observe these products after they have been formed. This usually occurs at the end of the process which doesn’t help us much. Routine oil analysis such as measuring the viscosity and acid number can alert users to the increasing levels of degradation. However, once we get to these levels, there are typically a sufficient amount of insolubles to already have the existence of varnish or sludge in the system. Hence we need to design monitoring systems which can identify these changes before the accumulation of varnish.
Ideally, the detection of a fluid’s varnish potential begins when the degradation process initiates the production of soluble and quasi-soluble contaminants. This usually occurs prior to the creation of varnish. When designing a system to monitor or detect these precursors, the following should be considered:
- Trending the increase of insolubles (even at small levels)
- Indication of early detection of thermal failure or oxidation
- Providing a potential root cause for the formation of varnish pre-cursors
- Monitoring the depletion of primary antioxidants
The following tests can help with these objectives:
- Colormetric Analysis – determines the degree of oxidation by-products in the sample.
- Gravimetric Patch – Insolubles are typically larger than 2 microns so their presence is not registered in the ISO particle count. A 0.3 micron or smaller patch can be used in low tolerance varnish applications. For those fluids with higher amounts of contamination a 0.8 micron patch can be used.
- Ultra-centrifuge – A visual rating scale is used to determine the degree of sedimentation and degradation by-products after the sample is spun in excess of 20,000rpm.
- Fourier Transform Infrared (FTIR) – can indicate the presence of oxidation by products through identification of their molecular fingerprint using infrared light.
- Interfacial Tension Test (IFT) – oxidation by-products can immediately affect the surface characteristics of an oil. This allows IFT to detect insoluble oxidation by-products at an early stage.
- RULER™ – this can measure the concentration of antioxidants which can be used to determine the oxidation stability of the fluid and aid in determining the root cause of varnish formation.
These tests can aid in alerting users of the potential for varnish in their system. Whether its oxidation or thermal failure, we should always monitor the condition of the lubricants in service to prevent the onset of varnish which can lead to unplanned equipment downtime.